UML Diagrams with Graphviz
digraph Couriers {

        fontname = "Bitstream Vera Sans"

        fontsize = 8
node [
fontname = "Bitstream Vera Sans"
fontsize = 8
shape = "record"
]
edge [
arrowtail = "empty"
]
Courier [
label = "{Courier|+ name : string\l+ home_country : string\l|+ calculateShipping() : float\l+ ship(): boolean\l}"
]
Monotype [
label = "{MonotypeDelivery|\l|+ ship(): boolean\l}"
]
Pigeon [
label = "{PigeonPost|\l|+ ship(): boolean\l}"
]
Courier -> Pigeon [dir=back]
Courier -> Monotype [dir=back]
}
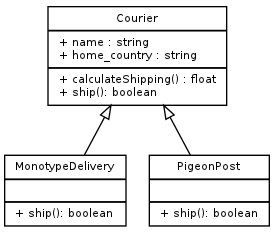
And the resulting diagram:

Working out the arrow styles and that I then needed to style the tail rather than the head was a puzzle. Beyond that, the record shape with lines worked well enough for this example, and I was pleased with the result. I find graphviz gives a very “clean” output – not pretty, perhaps, but easier on the eye than anything I could draw myself!

Thanx Lorna,
read about this some time ago already. And started making a small reverse engineer tool, which could save me the work. For more info see http://www.dannyvandersluijs.nl/puml/
Hello,
I’m very interested about creating class diagrams using graphviz, but I wonder how you can create complex class with it? I mean when you have lots of methods and variables, how do you escape the label property so it does not take 300 columns in your editor?
Honestly I would probably have the class details somewhere else like a config file, and then generate the dot source for the graphviz picture. It’s not particularly human-friendly.
I simply formatted it with newlines and it worked for me:
[code]
MyIdea [
label=”{
MyIdea|
+description:String\l
+status:int\l
+date:Date\l
}”
]
[/code]
Thank you very much, this will help my AP CSA class.